Imagine this – you open an app like Groww, Coin, ETMoney etc. to check the performance of your mutual fund. Next to every scheme, there are two numbers – Total Returns or Absolute Returns and XIRR.
For example, for a scheme, you might see absolute returns = 20%, and XIRR = 3.34%.
And you start to wonder – which number is telling me the true performance? 20% looks pretty good but that 3.34% not so much. And both are correct. So which one to focus on? Which number is telling me whether my mutual fund did good or bad?
Getting clarity on this question is what this article is about.
What are “Absolute Returns” or “Total Returns”?
Absolute returns tell you one thing in a very simple and straightforward way – how much gains you have made in percentage terms on the money you invested. The formula to calculate absolute returns is as follows:
For example, if you had invested Rs 100 and it became Rs 150, then your absolute returns are 50%. It doesn’t really matter whether the Rs 50 gains came in 1 year, 1 month, or 5 years. Regardless of the time period, your absolute returns will always be 50%.
And that is one of the biggest limitations of using absolute returns – it does not account for how much time it took for your money to grow. It just sums all your investments, checks the current value and tells you your returns.
But time is a very important factor when you are investing. Making 50% returns 1 year is in not the same as making 50% in 10 years. The first one is a highly desirable outcome. It signals that your money worked hard for you than it does in the second case.
One way you can measure your annual or per year rate of returns is using CAGR or Compound Annual Growth Rate. But CAGR works if there is only one investment that you did long time back and held on to that investments. It does not work with SIPs, or if there are multiple buy and sell transactions.
So here are the limitations of absolute returns when it comes to measureing your investment performance:
- Absolute returns do not account for the time your money took to grow.
- It does not provide the annual or per year growth rate. It just adds up all investment happening at different times.
because of these limitations of Absolute Returns, XIRR becomes the right metric to use. The XIRR:
- Accounts for multiple buy-sell transactions.
- Considers the time of each buy and sell transaction.
- Gives you a single annual or per year growth rate for your investments.
So without any further ado, let’s get into understanding what XIRR is and how does it work.
What is XIRR & How It is Calculated?
Before we get into the technical definition, imagine the following scenario (which is how things work in real life):
- You are doing monthly SIP of Rs 5000 for the last 6 months. Your total investment is Rs 30,000
- You get annual bonus at your work and you invest Rs 10,000 more into your mutual fund. Your total investment value is Rs 40,000.
- Then market falls by 10%, you get worried about losing money, and you sell Rs 25,000 worth of your mutual fund units. Your investment value drops to Rs 15,000.
- And when the market stabilizes, you reinvest those Rs 25,000 into your mutual fund. Your total investment is now again Rs 40,000.
- Suppose the current value of the investments is Rs 41,000. This means your gains are Rs 1,000.
In this scenario, it is pretty simple to calculate your absolute returns as follows:
2.5% doesn’t feel so good, does it? But the 2.5% number doesn’t give you the full truth, since it is not considering the different transactions and the timings of various transactions. Also 2.5% is not your growth rate per year, it’s just percentage growth. And that is why we turn to measuring XIRR.
,XIRR or Extended Internal Rate of Return is a rate at which your money grows every year taking into consideration each buy and sell transaction, as well as the date on which those transactions happened. As you can see, XIRR removes the limitations of Absolute Returns (and also of CAGR).
The only thing is XIRR calculation is tricky & can’t be done on a simple calculator. You need to use a Microsoft Excel Spreadsheet, or an online calculator like this one by Groww. In MS Excel, XIRR is calculated using the function “XIRR”. I will show you how to calculate XIRR in excel for the above example which has SIP transactions, a one-time investment, and one sell transaction which you quickly reversed by reinvesting.
There are a couple of rules you need to keep in mind when you calculate XIRR in Excel for your investments:
- Every buy transaction should be negative, and every sell transaction should be positive. Think about it like this – if money goes out of your bank account, it has negative sign, and if it comes into your bank account, it has a positive sign.
- Every transactions must have a corresponding date.
- If there are multiple transactions on the same date, then you can either club them together or add them on a separate lines.
- The current value of your investments should be at the end with positive sign. Again, think about it like this – if you sold everything today, this is how much you will get in your bank account.
- The first transaction should always be negative, i.e., an investment.
Take a look at the table below to understand all these things clearly:
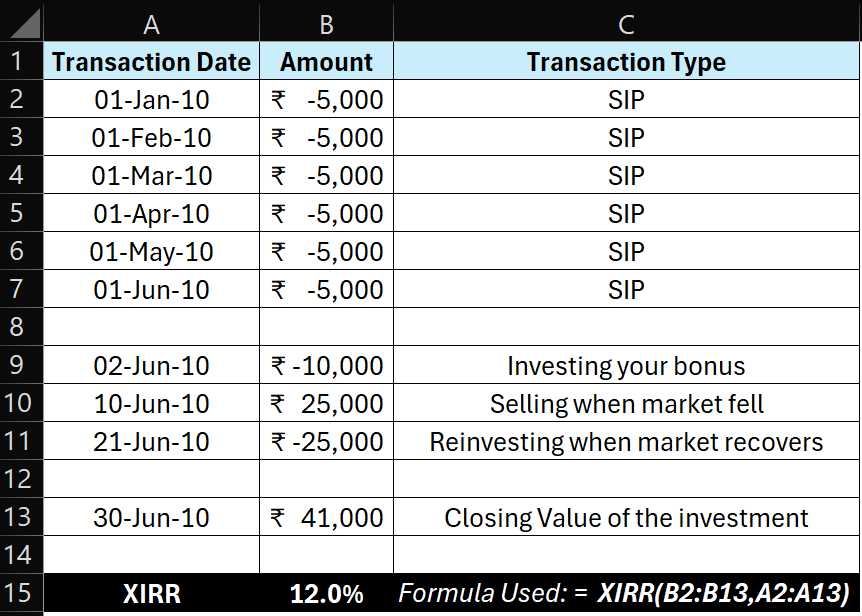
As you can see for yourself, the XIRR of the in our example investment is 12%. This is the rate at which all your money grew annually, considering the date and values of the transactions.
So, where your absolute returns showed you 2.5%, your actual annual growth rate is 12% per year. And that is the rate which is relevant when you do SIP, or do multiple buy-sell transactions in your mutual funds, stocks, and so on.
But why such a big difference? Well, the difference comes because your Rs 40,000 wasn’t invested for the full 6 months. It came in parts. So while the total gain looks small (Rs 1,000), your money was also invested for a short period, which leads to a higher XIRR. Remember again – XIRR gives you a per year rate for all transactions even if not all the money was invested for a full year.
Now, what would happen if you had invested Rs 40,000 at once on the date of your first SIP, stayed invested, and ended with the same Rs 41,000 at the end? See the table below which shows the XIRR calculation in Excel for this scenario:
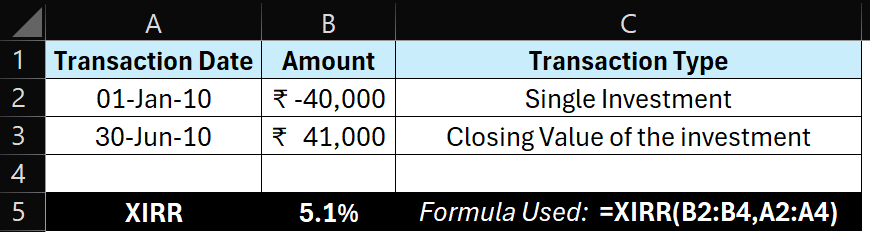
As you can see the XIRR comes to be 5.1%. Now this does not mean that putting all your money at once is a bad idea! These are just example numbers I used for simplifying the concept. While XIRR is sensitve to timing of the cashflow, it is also sensitive to the amount of each buy and sell transaction. Explaining that would get too technical and probably overwhelming at this point for you, so I will avoid goin into that.
Here’s an intereting question for you – is there any specific case when both your returns numbers – Absolute Returns & XIRR – become equal?
Indeed there is! When:
- You have only one investment transaction, and
- You have stayed invested for exactly 1 year without any transaction in between
Both your return numbers will be equal. For example, if you invest Rs 100 which become Rs 120 after 1 year, then your absolute returns, and XIRR will all be 20%. But if any of the two conditions above are not true, then the numbers will be different from each other.
So the next question you might be asking is when to use which metric for knowing the performance of your investments. Here are some simple rules about when to use CAGR, when to use Absolute Returns and when to use XIRR:
- When your investment period is less than 1 year, focus on absolute returns. This is because XIRR and CAGR both annualize your returns, meaning that if the value of your investment grows from Rs 100 to Rs 102 in 1 day, your absolute returns will be 2%, but Excel will show your XIRR as 3,678%. That is incorrect.
- Even if there are multiple transactions but your investment period is less than 1 year, focus on absolute returns again, because XIRR will inflate the gains or losses.
- When there is a single investment which you have held for more than 1 year, then you can use CAGR or XIRR and they will give you the per year rate of returns for your investment. Absolute returns, as we know, will ignore the time period.
- When there are multiple transactions and those transactions have taken place over more than a year, then XIRR is the only right metric to use.
Conclusion
Most of us invest via SIPs. We add some more money when we get it, take some money out when we need it for some reasons, and the journey goes on. If your SIPs have been going for less than a year, then you should focus on absolute returns alone. But if you have been doing SIPs for more than a year, then XIRR is the only metric that will give you the true picture of your returns.
And finally, all returns metrics can’t capture one of the most important things – your emotional experience of staying invested through the rise and fall in the markets. Everyday the market is open, all your return numbers change. Sometimes your XIRR goes to 20-25% and then falls to 8-9% – and even go negative when times are really bad. The pain that you feel while seeing your XIRR negative despite honestly doing your SIP for a year or more can’t be captured in numbers. But that is a story for a different day.
I hope you liked the article. If you have any doubts, let me know in the comments. I will be happy to answer them.
Thank you for reading,
Prathamesh
If you’d like to receive updates about my next post on email, Click Here.
If you’d like to receive updates about my next post on WhatsApp, Click Here.
By signing up, you agree to the Terms and Conditions and Privacy Policy of our website.

About Prathamesh
I am an IIM Bangalore alumnus. I was wealth manager for some of the riches HNI-UHNI families in India. Then I decided to venture out on my own to bring that expertise for everyday Indians. I am working to make highest-grade investment advisory accessible to every Indian. IMO the lesser the welath someone has, the more they can benefit from professional guidance. I like to write and talk about everything finace - investing, insurance, debt management, behavioral finance and so on. When I am not writing, I am making educational videos. And when I am not doing that either, I am catching up with the lates comedy or thriller shows and movies.